
Housing Shortages Drive Differences in Multifamily Vacancy Rates
Markets With High Supply Barriers in Better Position To Weather Weakness in Demand
Weak multifamily demand through most of 2022 has increased apartment vacancy rates, but occupancy has historically performed better in some markets than others. Studying the distribution of rents and renter incomes helps show why by indicating the severity of housing shortages.
The distribution of rents and renter incomes in this analysis was limited to downtown locations only in order to limit potential competition from single-family rentals. Income data from the U.S. Census at a tract level from 2019 was aggregated for renter incomes, and CoStar rents from 2019 were tranched based on a 30% rent-to-income ratio, so that a comparison could be made between the distribution of the two data sets.
At a national level, the largest cohort of renter households by income in downtown locations are those making over $150,000 per year, as of 2019 data. However, about 30% of renter households in those locations earned less than $35,000 per year. At a 30% rent-to-income ratio, that suggest the bottom 30% of renter households could afford only about 4% of the available units in downtown locations, as that is the percentage of units that charge less than $875 per month in rent.
Clearly, the results of the analysis don’t reflect reality, which is more nuanced. Various rental assistance programs based on affordability, such as Section 8, allow low-income renters to afford a larger percentage of units than this analysis would indicate. But comparing ratios by market is instructive in identifying those regions facing larger supply constraints.
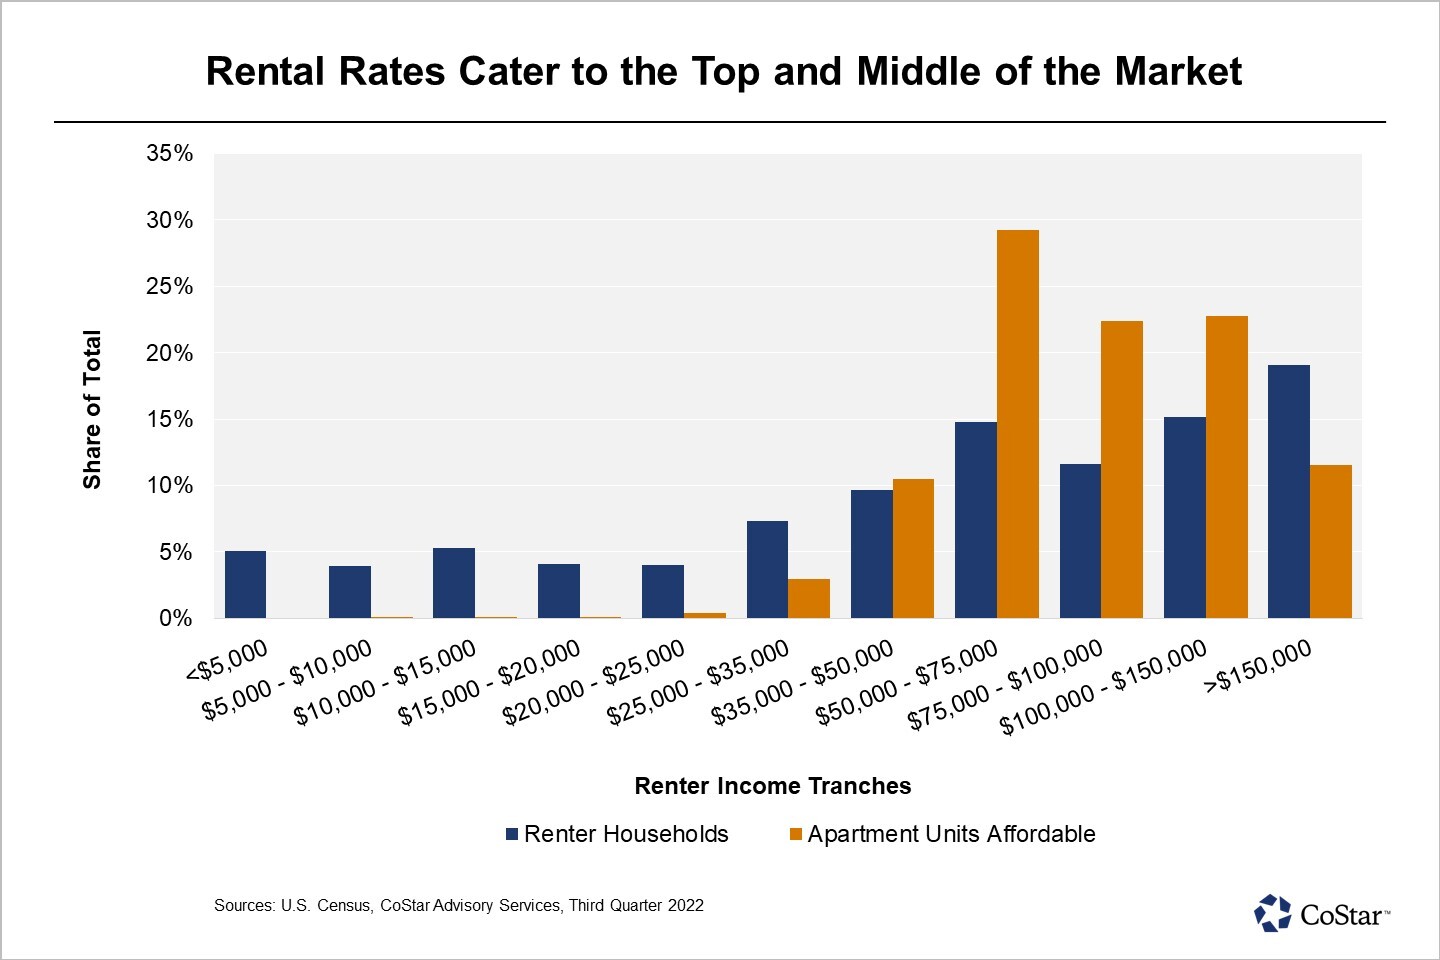
At a national level, about 45% of downtown renter households made more than $75,000 per year in 2019, while 57% of rental units leased at more than $1,875 a month, the 30% rent-to-income threshold for these households. As a result, the share of renter households that can afford a unit at the 30% rent-to-income ratio is 12 percentage points lower than the share of downtown units that are available at that 30% of income threshold. Affluent households have more leverage; indeed, CoStar’s data indicates that the most expensive housing in a metropolitan area generally has the lowest occupancy.
At a metropolitan-area level, though, rent-versus-income dislocation can become extreme. In New York, 57% of downtown renter households in 2019 made over $75,000 a year, but 96% of units rented at $1,875 per unit, meaning the shortfall of affordable units was about 40 percentage points.
It is worth mentioning that CoStar does not have complete coverage on rents, and that the Census’ coverage is inexact. These numbers miss plenty of rentals, including single-family rentals, as previously mentioned, rented condominiums and smaller buildings for let.
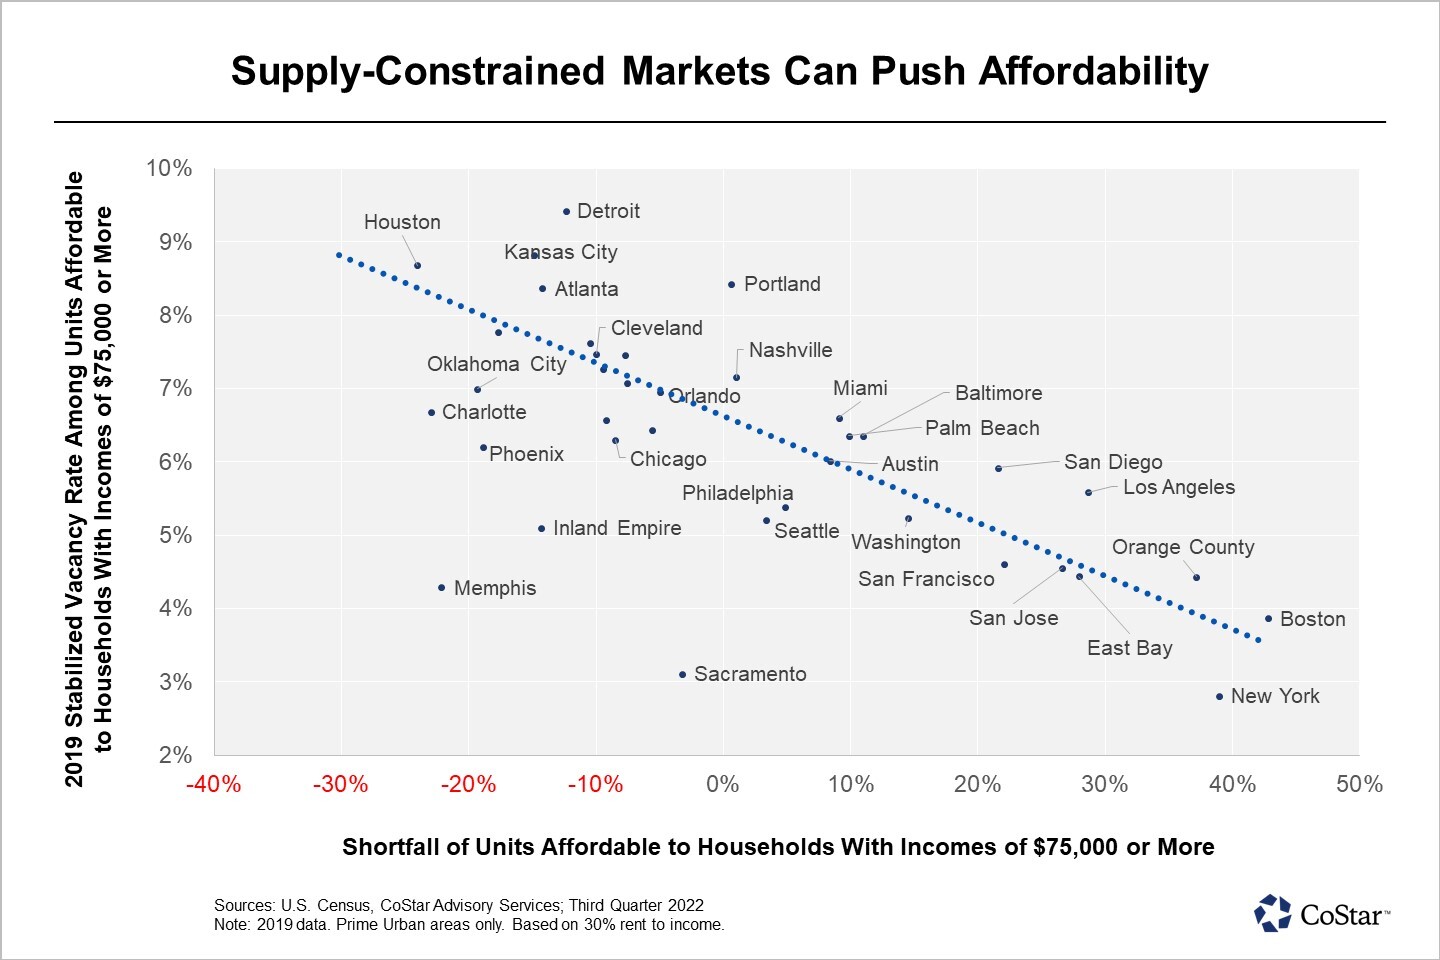
Nevertheless, the relationship between the overabundance of high-cost units and vacancy is important. The more skewed the distribution of downtown rents are to the high-end versus the distribution of incomes, the lower stabilized vacancy was in 2019, and in fact, across history.
The classic core multifamily markets had the largest share of high-cost units. Boston and New York lead the pack, followed by the major California markets. Washington, Seattle and Chicago rank more in the middle of markets, but Chicago is the only one where the ratio of units that are affordable to households earning $75,000 or more falls in favor of households.
The implications are a little strange to consider. Essentially, the housing market in downtown Boston is so skewed towards high-cost units, that households earning between $50,000 and $75,000, which accounts for 13% of all households, can only afford 8% of rental units at a 30% rent-to-income rate. Everything else is more expensive than that. Those wealthier households are competing against households making less than $50,000 as well, thereby virtually ensuring up-renting, wherein a household rents a unit that’s more expensive than the 30% rent-to-income ratio supports.
While the suburbs are theoretically a viable alternative, that may not be an option for renters who do not own a vehicle. Even extending the analysis to the whole region, Boston still has a significant skew to expensive units. Plotting the shortfall of units affordable to households earning $75,000 or more against more traditional demographic housing shortfalls reveals a strong correlation of about 0.57, meaning the shortfall of affordable units is probably a good indicator of under-building.
If Boston represents one side of this housing affordability coin, the other could well be Houston, which has much lower supply constraints. Fifty percent of Houston’s downtown renter population made more than $75,000 in 2019, but only 24% of units charged more than $1,875. A majority of units, 51%, catered to the $50,000-$75,000 income range, though as with the national average, almost no units were affordable to households making less than $25,000 without subsidies.
The Houston example is instructive for a few reasons. First, even with no zoning rules and lower development hurdles, a market will have a hard time supplying housing for very low-income households. There are certain minimum standards, including heating and fire safety, that housing must meet in America, which raises expenses and makes subsidies a necessity. Second, a looser zoning environment does create a cheaper housing. Those markets that have higher housing-to-population ratios don’t have rents pushed as hard into the upper echelons of affordability. Third, households are willing to down-rent when they’re able, meaning they’ll rent a unit that’s cheaper than their income would suggest is affordable. A higher vacancy rate in Houston affords renter households more choice. In 2019, there was a larger share of renter households making more than $75,000 than there was a share of units charging more than $1,875 a month. This implies that some of those wealthier households were renting below the $1,875 a month line. Assuming price is at least a moderate indicator of quality, these richer households were probably competing with poorer households for the same mid-level quality units. As with the Boston example, there are other options for richer households, such as purchasing houses in the suburbs, but for some households, location is the amenity that matters most.
Stabilized multifamily vacancies today show similar relative values between markets as they did in 2019, but there are some notable outliers. In San Francisco, apartment vacancy has spiked, although it can be assumed that the renter household distribution in San Francisco has changed meaningfully too. Arguably that’s what likely caused the vacancy spike, as tech workers newly freed by remote work fled the city. Unfortunately, the census data used to create this analysis isn’t available at the tract level for 2021 yet, but San Francisco would surely be one of the most affected by the changes.
For other multifamily markets, those that had an overhang of units affordable to households making $75,000 a year were arguably under-housed, and under-housing through a downturn should result in better occupancy and rent growth. Although the current environment is projected to be short-lived, there’s a case for owning multifamily assets in an under-housed market in normal times too, as that pressure keeps buildings well occupied. However, an important caveat is that a market with these underlying housing pressures is probably the most susceptible to rent growth regulation. These markets have lower vacancy risk, but lower than average rent growth. For certain investors, that will still be attractive.
Andrew Rybczynski is a principal consultant based in CoStar’s Boston office.